When evaluating the current Denver Metro real estate market, it is important to look beyond what you hear and even more important to be able to interpret what is happening. By watching and analyzing a few key metrics, you can navigate this market with confidence.
While it is indeed a strong sellers’ market thirsting for more inventory, more homes were purchased in 2021 than any of the five previous years. Interest rates remained lower throughout the year before starting to creep up early in 2022. For buyers, the current market still offers opportunity for those who are active and patient.
Two simple tricks for reading the tea leaves that are the Denver Metro housing market: (1) look at both mean (average) and median as they may reveal something slightly different about a single metric and (2) combine certain metrics to get more meaningful insights.
MEAN vs. MEDIAN
The average close price for a home in Denver Metro in 2021 was $612,274, while the median close price was $525,000. In other words, half of the homes sold last year closed at or below that $525k price point. That is a significant difference and opens possibilities for buyers who think they are shut out when they only read the averages.
You see something similar when you look at days on market. The average was 14 days for last year; the median was 4 days. This means more than half of the homes that hit the market were under contract during or just after the first weekend of being listed. That creates a different sense of urgency for buyers while setting different expectations for sellers when marketing their home..
COMBINING METRICS
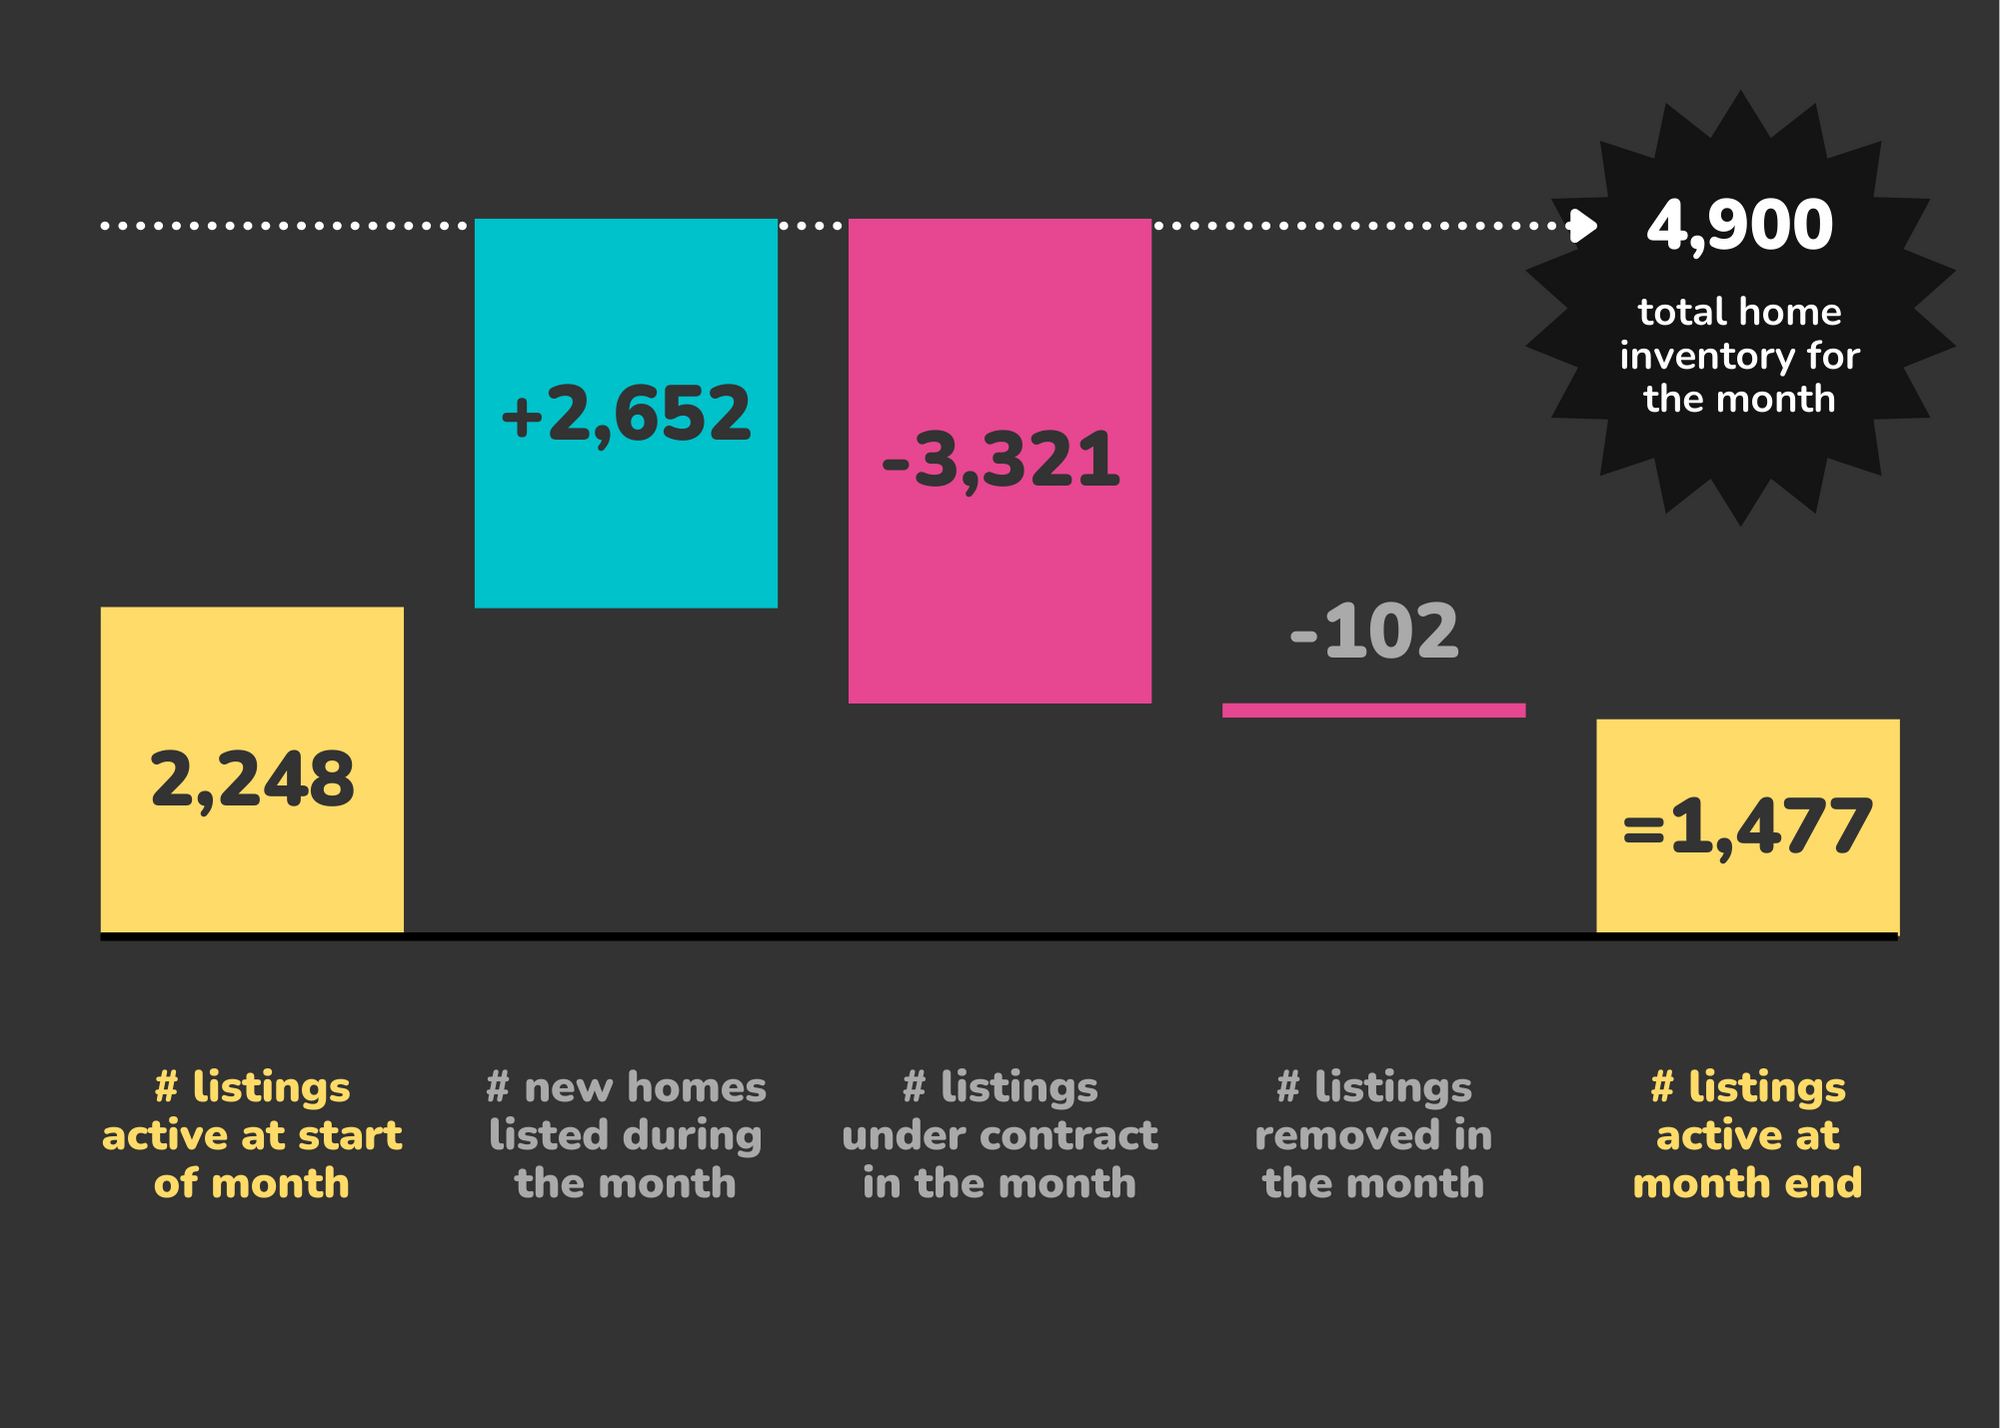
Perhaps the most misunderstood metric is the inventory number. That number (1,477 in December), represents the active listings still on the market at month end, not how much inventory was available during the month.
An easier way to look at inventory is to think of your favorite store — what is left on the shelf after shoppers have either bought or have the desired item in their cart on the way to pay? That 1,477 homes last month only represents what was left on the shelves. Just because the shelves may be near empty, doesn’t mean that there weren’t available items to buy.
Applying that further, we can look at the whole Denver Metro inventory picture. In December, there were 2,652 new listings (placed on the shelves for purchase). From those new listings and from items still on the shelf at the end of November, 3,321 were under contract at month end (waiting in the check out lane) and 4,504 homes closed (paid for and left the store). Not super high numbers by any stretch, but they do reveal a different story than if you only focused on the active listings number.
Refer to the chart below to see how the inventory numbers stack up.

PIECING IT TOGETHER
Companies and families are still adjusting to a new normal while navigating COVID variants, meaning this work- and learn-from-home revolution is going to be part of the new normal. The technology supports it and many companies are seeing productivity gains from employees while lowering operating overhead. With up to 2 parents working from home and children learning from home, more space will continue to be paramount.
So as we gear up for 2022, and what is expected to be another highly competitive market, it is important to have all of the facts, and the right facts at that, so that you can best navigate this market with success.
Data source: DMAR Real Estate Market Trends Report
The Denver Metro Area encompasses 11 counties: Adams, Arapahoe, Boulder, Broomfield, Clear Creek, Denver, Douglas, Elbert, Gilpin, Jefferson, and Park.


Recent Comments