Highlights
While only a slight uptick in average close price overall, attached homes set an all-time high with an average just over $504k
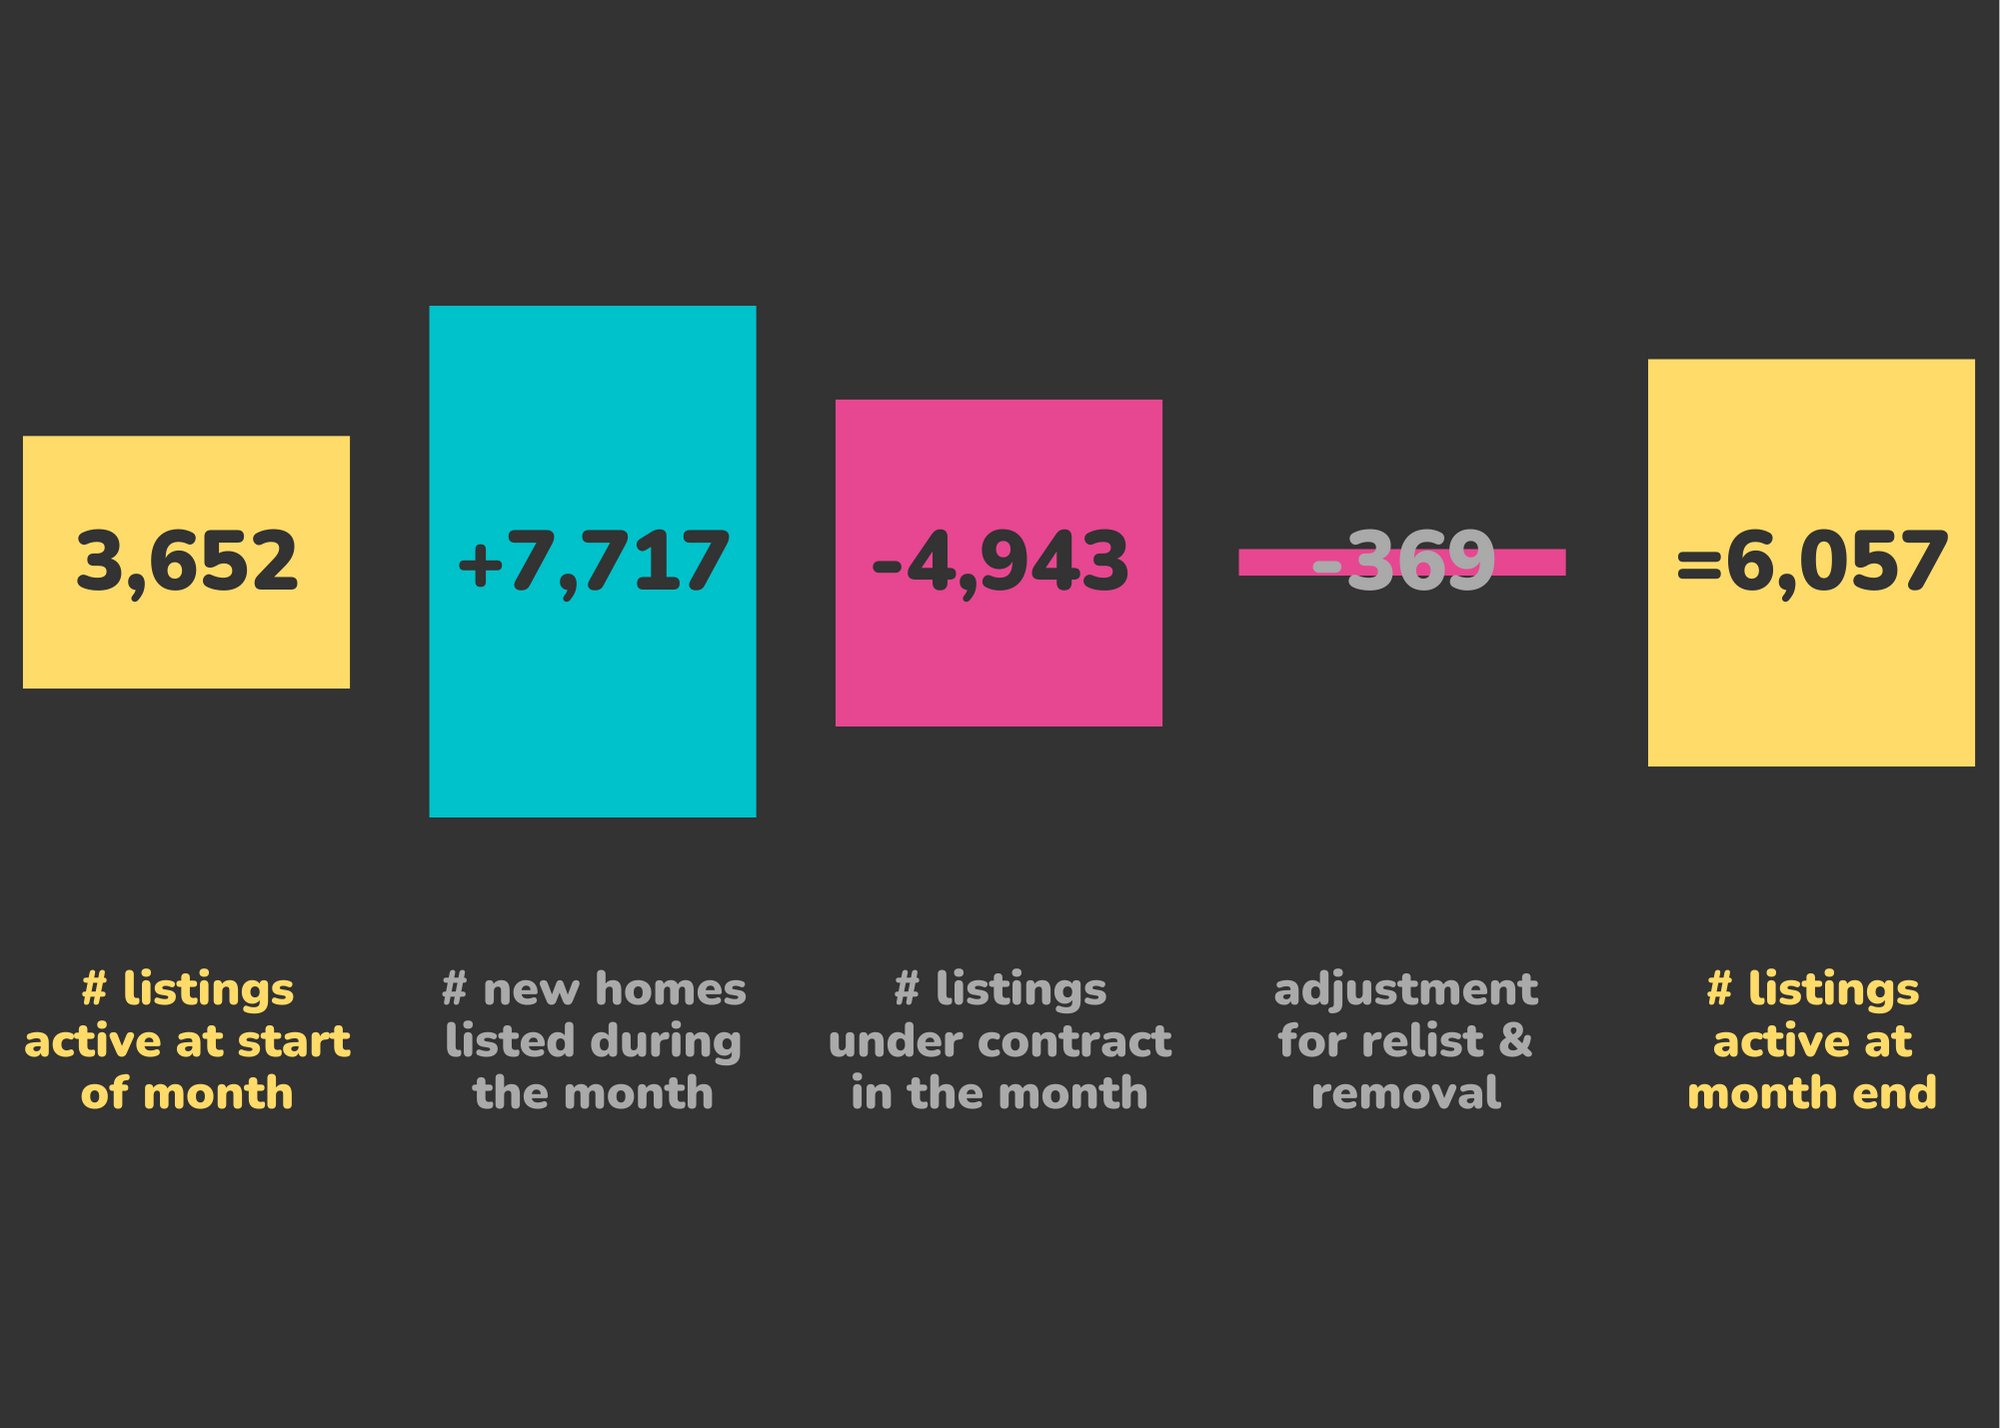
Available inventory jumped nearly 66% (and is up 94% over last year), boosting supply over 1 month (to 1.12) for the first time in 2 years
Despite higher interest rates, more supply will mean better opportunities for buyers with homes on the market longer leading to lower sales prices
inside the numbers
5,090
homes closed
sales price breakdown
Click chart to enlarge; scroll down to see how to read the chart
Average sales prices is up slightly from May and down from April, while buyers are paying $26k less over list price than 2 months prior
4,943
homes under contract
days on market by segment
Click chart to enlarge; scroll down to see how to read the chart
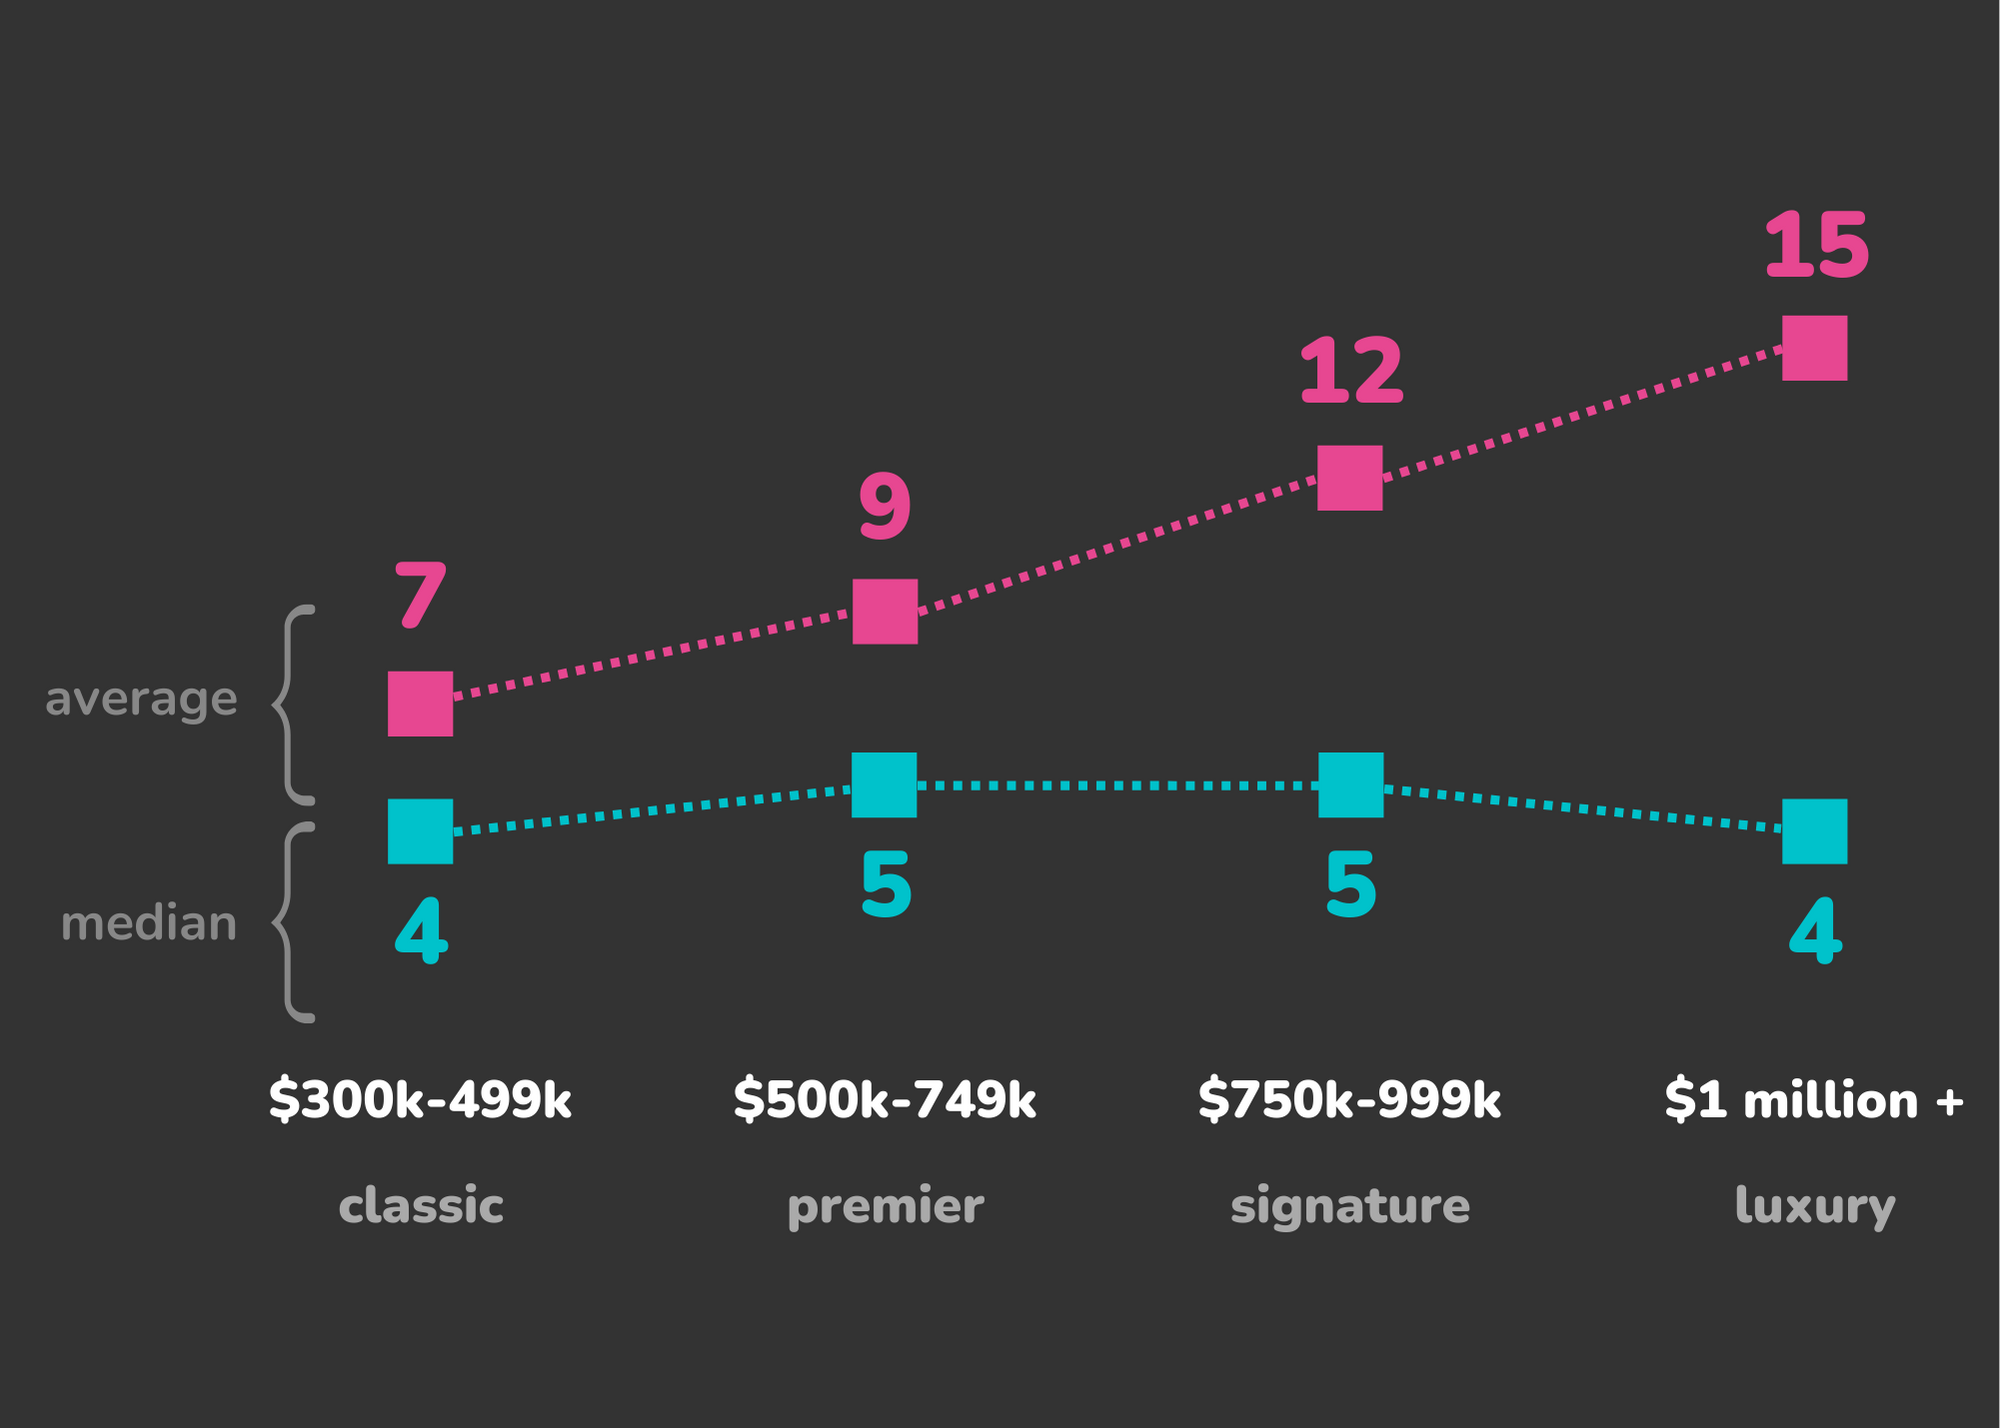
Days on market inched up again in all segments and is up 1 day to 10 days over last month, a trend expected to continue with increased supply
Data source: DMAR Real Estate Market Trends Report
The Denver Metro Area encompasses 11 counties: Adams, Arapahoe, Boulder, Broomfield, Clear Creek, Denver, Douglas, Elbert, Gilpin, Jefferson, and Park.


Recent Comments