Market Insights
-
With new listings, closings, and average close price down, the market continued to normalize as is expected in the fall and looks to be leveling out through the holidays.
-
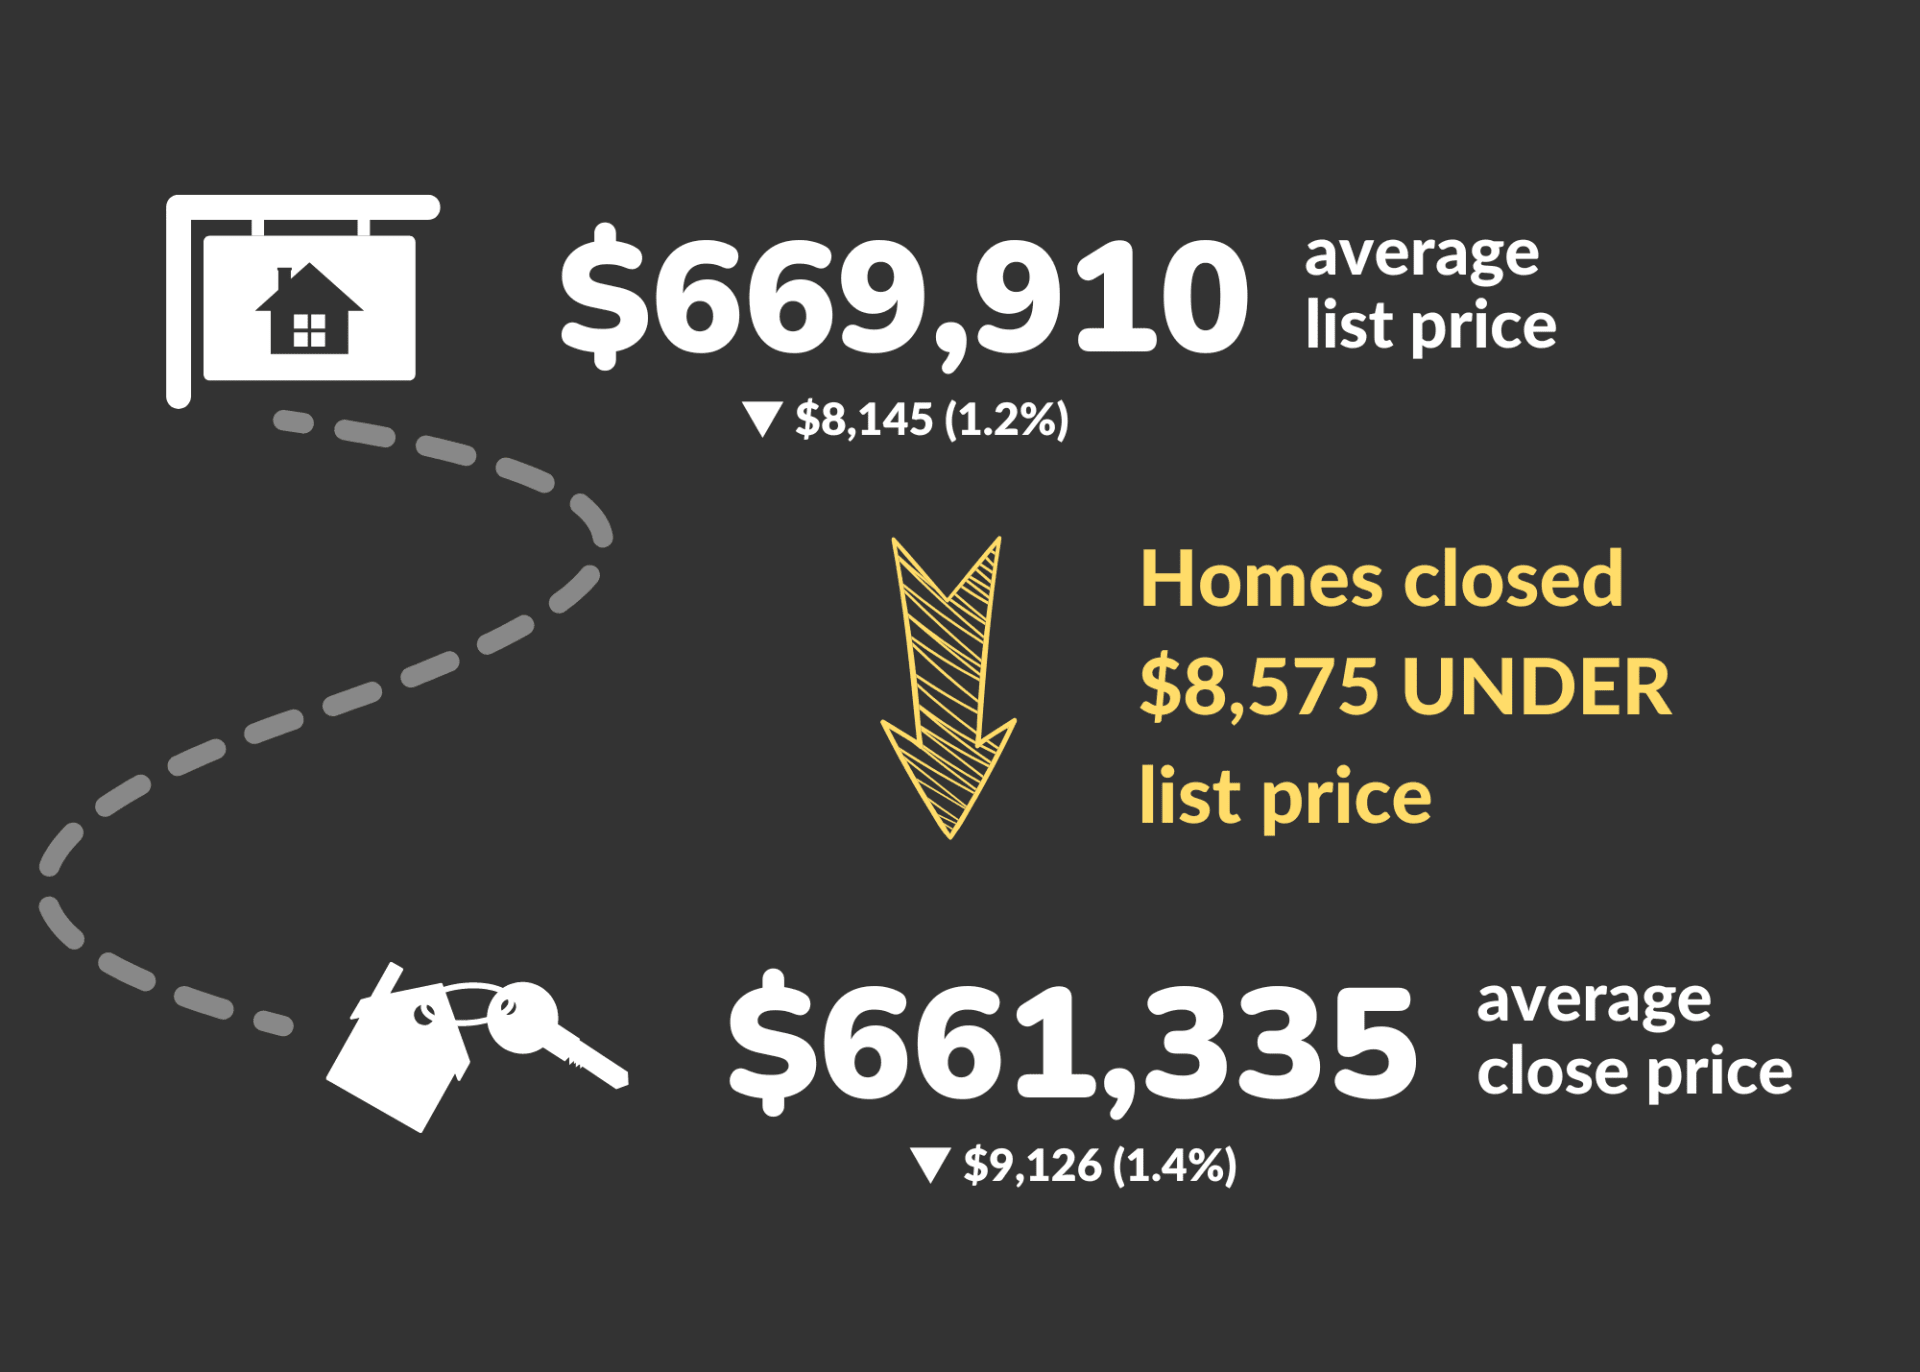
Sign sellers are being forced to adjust with the market, the average list price dropped ($8,145 or 1.2%) for the first time in a long while.
-
Average days on the market were up from 26 to 28 days, with more than half spending at least 17 days on the market and 60% of listed homes reducing price.
Growing up in New England, fall has always been my favorite season. With the changing colors and cooler temperatures came apple picking, pumpkin carving, and corn mazes. It is all very nostalgic for me and brings about a calmness and normalcy before we head into the holidays.
You could say the same thing about the current housing market in Denver Metro. After years of record appreciation and a strong seller’s market, things have been normalizing and shifting toward greater balance. Behind us (for now) are the chaotic days of each buyer having to waive inspection, offer large appraisal gaps, or throw $50,000+ extra at homes. In its place, some calm buyers can be patient in finding the right home.
Sellers, for their part, continue to benefit from the recent period of historic appreciation and are able to trade up, trade down, or move on with equity in hand despite the recalibration. Six months ago, you could sell a home with iPhone pics. Now, with a more balanced market, success means being strategic and organized with professional photos, conservative pricing, and aggressive marketing.
Inside the Numbers
There is no question that both supply and demand are down. Factors such as inflation, higher interest rates, a return to office for many, and even the upcoming election are impacting the market. Yet, a slowdown is normal for this time of year and is expected to carry through the holidays.
New listings, closings, and sales volume were all down about 25% when compared to last month. Average sales price and median sales price were down slightly (1.4% and 2.4%, respectively), while days on the market continued to increase (up to 28 days from 26 last month). Underscoring those numbers, almost 60% of homes on the market lowered their list price while active… in other words, more than half!
Exciting for me is watching the dance between the list price and the close price. As I noted in this space last month, the average list price was at its peak despite the average close price being down $50k and days on the market being up 10 days (when comparing April 2022 to September 2022). In the past month, the average list price finally started to come down — from $678,055 to $669,910 (down 1.2%).
What Comes Next
Even though the average list price decreased for the first time in a while, homes continued to close, on average, under the list price at $8,575, even more so than the previous month ($7,594). It will take some time for the market to right itself from the inflated prices caused by the frenzy earlier this year.
The holiday season is typically slower and with good reason. With demand down, sellers are inclined to wait until the spring when the market is known to pick up again. Buyers, on the other hand, are usually focused elsewhere or waiting for that raise to kick in early next year. However, this year may prove different as buyers, fearful of higher interest rates next year, may not want to wait and are ready to buy now.
There is an opportunity and a win-win out there for those who know how to navigate this shifting market and have a great Real Estate Agent at their side.
Inside the Numbers
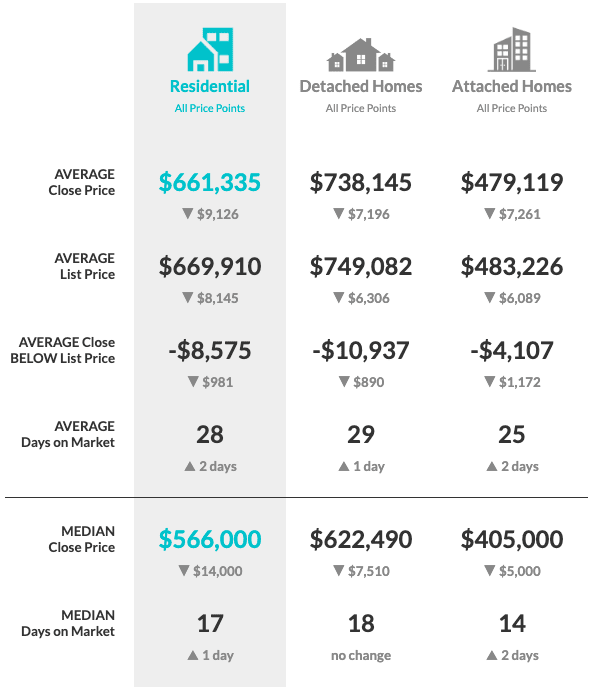
Comparing Close Price to List
As sellers adjust to a balancing market with homes closing under the list for a third straight month, the average list price was down for the first time in a while.
Monthly Inventory Movement

Month-end inventory was only down slightly, despite a 26.7% decrease in new listings, leaving some great homes on the market for buyers.
Cover photo courtesy of Amanda Rodell. Visit her on Shutterstock at AKRodell or click here.
Data source: DMAR Real Estate Market Trends Report. I am a member of the DMAR Market Trends Committee which compiles and publishes the report.
The Denver Metro Area encompasses 11 counties: Adams, Arapahoe, Boulder, Broomfield, Clear Creek, Denver, Douglas, Elbert, Gilpin, Jefferson, and Park.